
FIGURE 7.
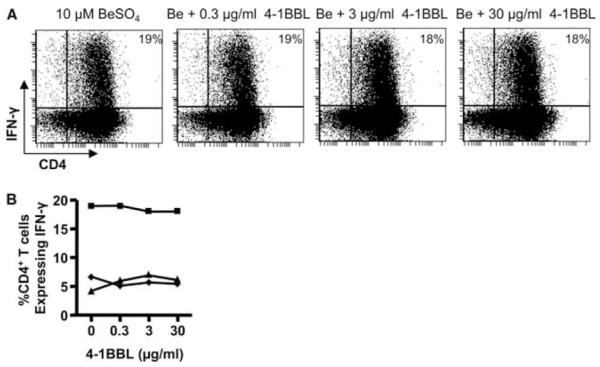
Intracellular IFN-γ expression after BeSO4 stimulation of BAL T cells from CBD patients with and with the addition of anti-4-1BBL mAb. A, A representative experiment is shown for the flow cytometric analysis of BAL CD4+ T cells from a CBD patient stimulated with 10 μM BeSO4 in the presence of varying concentrations of anti-4-1BBL mAb and subsequently stained for surface CD4 and intracellular IFN-γ. The number in the upper right quadrant of each density plot is the percentage of CD4+ T cells that express IFN-γ. B, Percentage of BAL CD4+ T cells from three CBD patients expressing IFN-γ in response to BeSO4 in the absence and presence of 0.3, 3.0, or 30 μg/ml anti-4-1BBL mAb is shown.