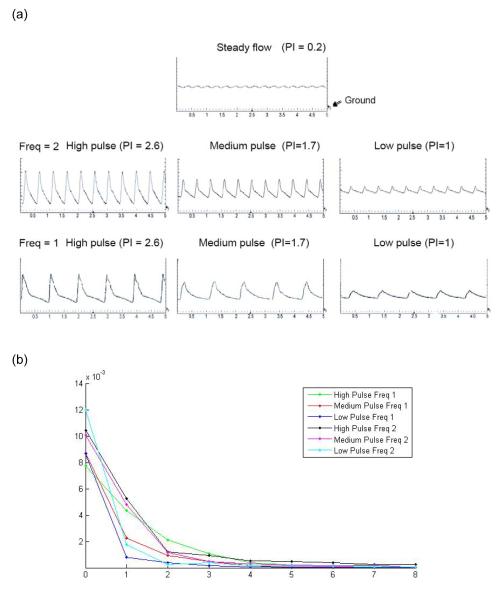
Figure 2.
(a) Flow waveforms demonstrated experimental conditions including the steady flow and the arterial-like pulse flow waves with varied pulsatility, i.e. low pulsatility (PI=1), medium pulsatility (PI=1.7) and high pulsatility (PI=2.6), at the frequency of 1Hz or 2Hz. The flow waves were plotted by oscilloscope showing the relationship between voltage representing the flow rate and time. The graphs had time (unit: second) on the x-axis and voltage on the y-axis with minimal division set at 200mV or 2ml/min. Ground shows the point of 0mV. (b) Spectral analysis of the high, medium and low pulse flow waveforms.

