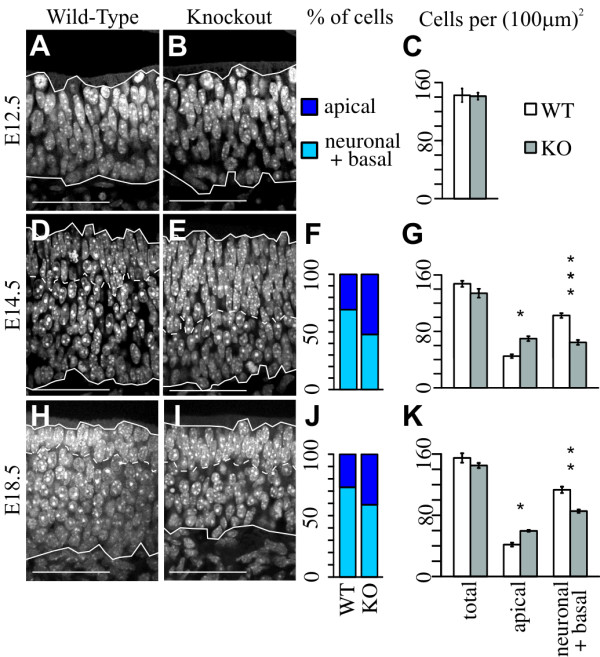
Figure 2.

Increase in the number of apical cells and concomitant decrease in the number of neuro-basal cells in the OE of Insm1-/- embryos. Representative DAPI stained images from coronal sections of (A, D, H) Insm1+/+ embryos and (B, E, I) anatomically aligned sections from paired Insm1-/- littermates. Solid lines indicate the apical (top) and basal (bottom) margins of the OE, and dashed lines indicate the interior border of the apical compartment. In Insm1-/- mice at (D-G) E14.5 and (H-K) E18.5, the number of apical cells per (100 μm)2 of total OE surface is 57% greater (n = 4 embryo pairs, total of 12 aligned section pairs, P < 0.05) and 44% greater (n = 3 embryo pairs, total of 9 aligned section pairs, P < 0.05), respectively, than in paired Insm1+/+ littermates. Correspondingly, the number of neuro-basal cells decreases by 37% at E14.5 (P < 0.001) and by 24% at E18.5 (P < 0.01). As a percentage of total cells, at E14.5 apical cells make up 30% of the OE in Insm1+/+ embryos and 52% in Insm1-/- embryos (F). At E18.5, apical cells make up 27% in Insm1+/+ embryos and 41% in Insm1-/- embryos (J). At E12.5, the apical and basal layers are not yet apparent. However, there is no detectable difference between the overall thickness of the OE at any stage (P = 0.98 at E12.5, P = 0.07 at E14.5 and P = 0.17 at E18.5; n = 3 embryo pairs, total of 9 aligned section pairs at E12.5). Data in (C, G, K) are presented as mean values ± standard error of the mean (SEM). *P ≤ 0.05, **P ≤ 0.01, ***P ≤ 0.001. Scale bars: 50 μm. KO, knockout; WT, wild type.
