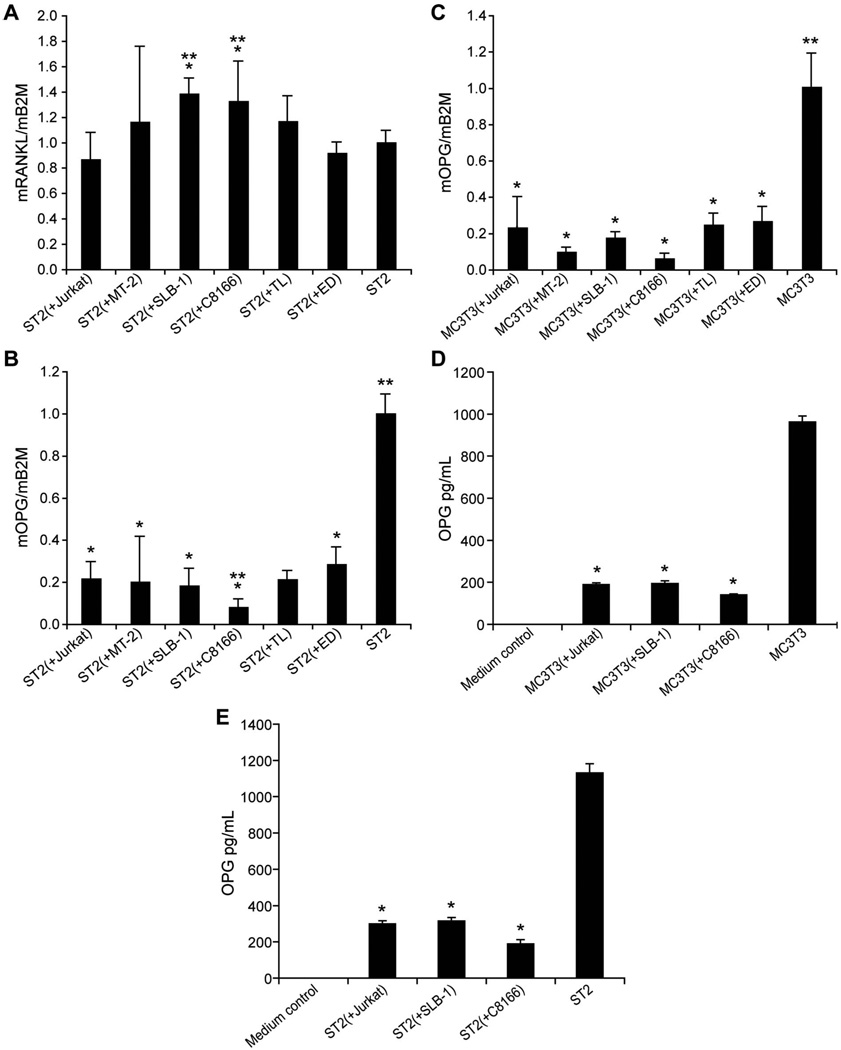
Figure 4.
T-cells affected RANKL and OPG levels in co-cultured pre-osteoblasts. Real-time RT-PCR results of (A) RANKL and (B) OPG in co-cultured pre-osteoblast ST2 cells. The symbol ‘*’ indicates p < 0.05 when compared to ST2 cells. The symbol ‘**’ indicates p < 0.05 when compared to ST2 (þ Jurkat). (C) Real-time RT-PCR results of OPG in co-cultured pre-osteoblast MC3T3 cells. The symbol ‘*’ indicates p < 0.05 when compared to MC3T3 cells. Secreted OPG concentrations in conditioned media from (D) T-cells and ST2 cells and (E) T-cells and MC3T3 cell co-cultures. The symbol ‘*’ indicates p < 0.05 when compared to ST2 or MC3T3 cells alone.

