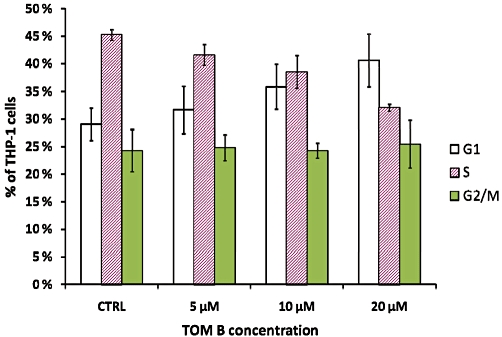
Figure 2.

Tomentodiplacone B (TOM B) induces THP-1 cell accumulation in G1 phase. Data from flow cytometric analysis of the DNA content of THP-1 cells treated with TOM B for 24 h. The bars show the distribution of TOM B-treated THP-1 cells in the phases of the cell cycle. Values shown are the means ± SEM of the percentages of cells in individual phases of the cell cycle from three independent experiments. CTRL, control.
