
Figure 9.
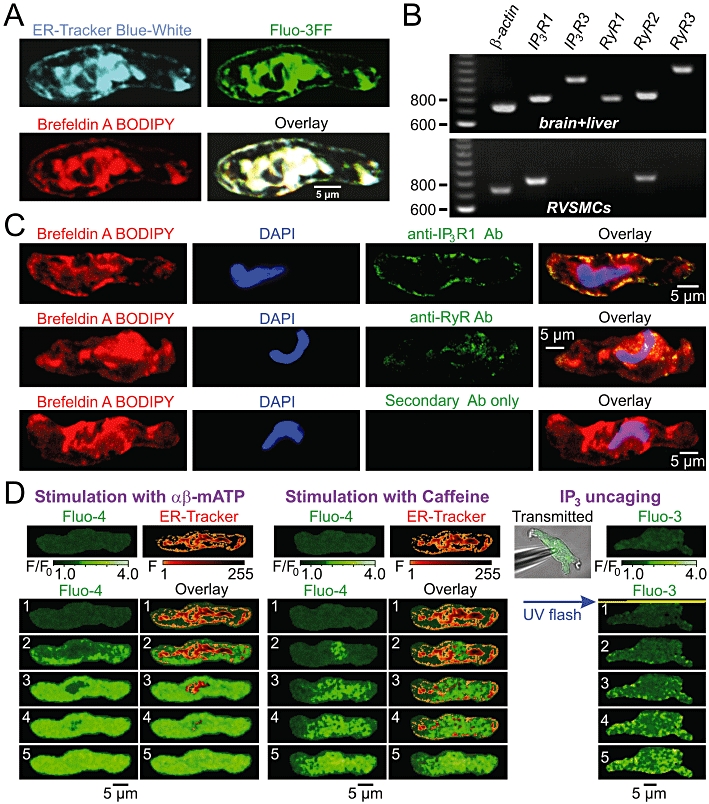
Spatial distribution of the sarcoplasmic reticulum (SR) Ca2+ release channels in renal vascular smooth muscle cells (RVSMCs). (A) Confocal images of the ER-tracker Blue-White, Fluo-3FF and Brefeldin A BODIPY fluorescence, and their overlay illustrate spatial organization of the SR in RVSMC. (B) RT-PCR analysis of inositol 1,4,5-trisphosphate receptor (IP3R) and ryanodine receptor (RyR) expression in RVSMCs. Primers designed to amplify genes encoding IP3R and RyR subtypes: IP3R1 (806 bp), IP3R3 (966 bp), RyR1 (793 bp), RyR2 (824 bp), RyR3 (1086 bp) were tested for their specificity using cDNA preparations of rat brain and liver tissue (top) before using them on RVSMC preparations (bottom). RVSMCs were found to express genes encoding IP3R1 and RyR2. (C) Immunodetection of IP3R1 (top) and RyR (middle) in RVSMC stained with Brefeldin A BODIPY and DAPI. Primary antibody binding was detected with MFP488-conjugated secondary antibody, which shows no non-specific binding in the absence of primary antibody (bottom). Confocal images highlight localization of IP3R1 in sub-plasmalemmal SR and RyR in deeper SR. (D) RVSMCs were either pre-incubated with Fluo-4AM and ER-tracker Blue-White (pseudocolour confocal images) and stimulated sequentially with 10 µmol·L−1αβ-methylene ATP (αβ-meATP) (left) or 5 mmol·L−1 caffeine (middle), or loaded with Fluo-3 and ‘caged’ IP3 via patch pipette (transmitted light and confocal images) and stimulated by whole-cell UV flash (right). Galleries of five sequential images (labelled 1–5, bottom) highlight spatial patterns of the initial phase of the responses.