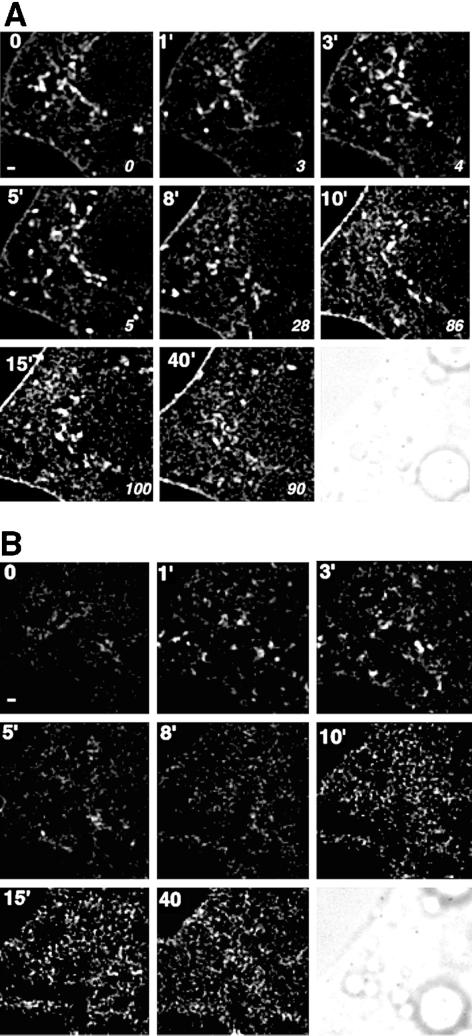
Figure 4.
Higher resolution imaging of GLUT4-eGFP. Images were acquired at settings that result in a resolution of 133 nm/pixel. The bar at the lower left corner of the first panel is 800 nm. (A) Panels represent a single 250-nm section through the middle of the cell acquired at the times (Min et al., 1999) after insulin addition indicated in the top left corner. Italicized numbers in the bottom right corner of each panel represent the percentage of maximal effect of insulin, which was calculated as described in Figure 3B. A phase image of the cell is shown in the first panel. (B) Panels represent a single 250-nm section through the bottom of the cell acquired at the times after insulin addition indicated in the top left corner.

