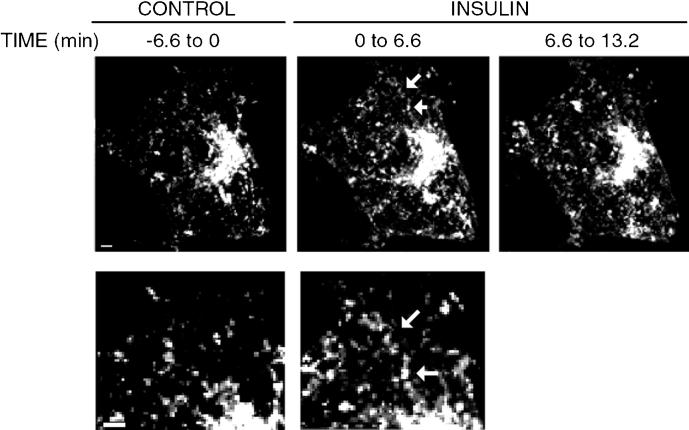
Figure 6.
Motility of GLUT4-eGFP revealed by 2D projection of 4D images. 100 stacks of 21 sections taken before (CONTROL), or after insulin addition (INSULIN, 0 to 6.6 and INSULIN 6.6 to 13.2) were summed and displayed as 2D images. Arrows point to a region were a linear track is defined by the presence of a contiguous GLUT4-eGFP signal. Bottom panels are an amplification of the same region from the cell from the before and after insulin sets. Bars on the lower left corner represent 3 um.

