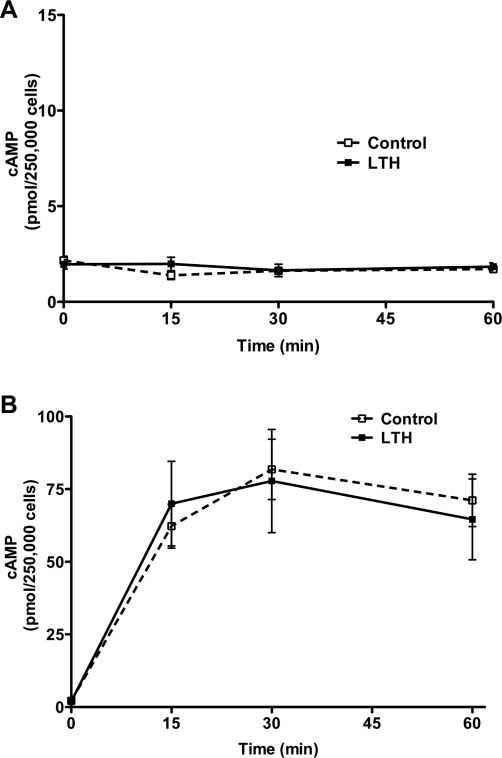
Figure 2.
Time course of basal (A) and ACTH-stimulated (B) cAMP production in control and LTH FACs. There was no difference in either basal or ACTH-stimulated cAMP generation between control and LTH FACs (n = 6 for each group). LTH indicates long-term hypoxia; FACs, fetal adrenal cortical cells; ACTH, adrenocorticotropic hormone; cAMP, cyclic adenosine monophosphate.

