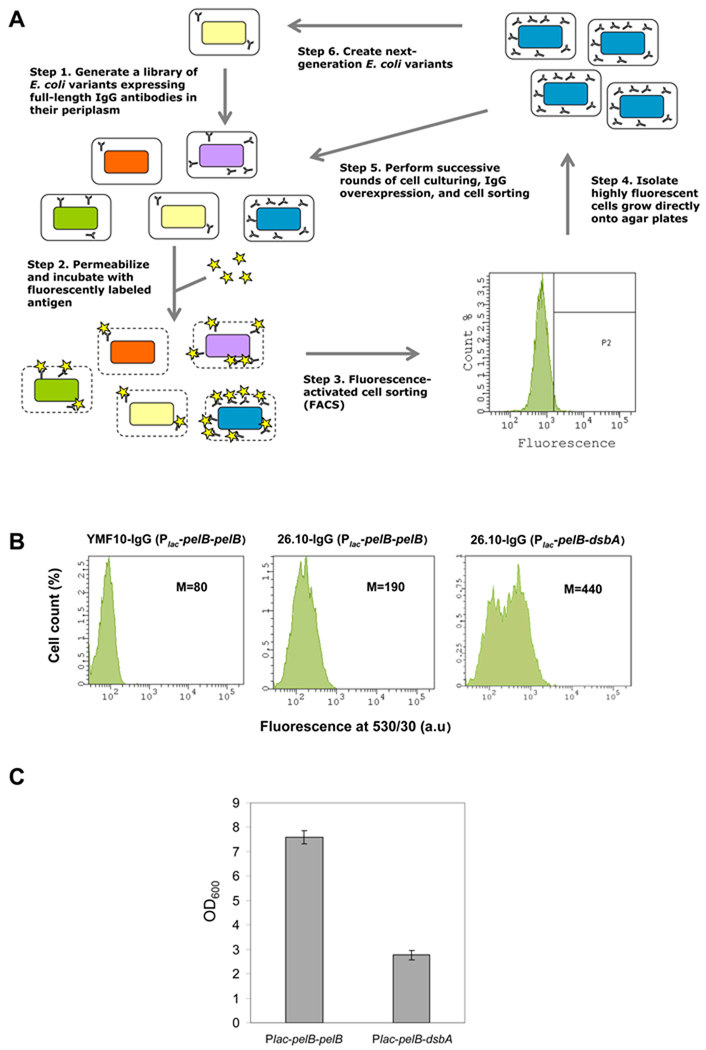
Figure 1. Single-cell Fluorescent Detection of IgG Expression.
(A) General scheme of E. coli mutagenesis and isolation of clones displaying increased IgG expression using periplasmic expression with cytometric screening (PECS). (B) Fluorescence histograms of E. coli JUDE-1 cells over-expressing either 26.10 IgG or YMF10 IgG (anti-PA antibody (Mazor et al., 2007)); negative control) with different combinations of leader peptides for heavy and light chain periplasmic export. Statistics correspond to a population of 10,000 cells. M: mean fluorescence intensity. (C) Growth of E. coli JUDE-1 cells over-expressing 26.10 IgG antibody with different leader peptides for heavy and light chain periplasmic export. OD600: optical density at 600 nm, Plac-pelB-pelB: lac promoter with pelB leader peptide for light and heavy chain periplasmic export, Plac-pelB-dsbA: lac promoter with pelB leader peptide for periplasmic export of light chain and dsbA leader peptide for periplasmic export of heavy chain.

