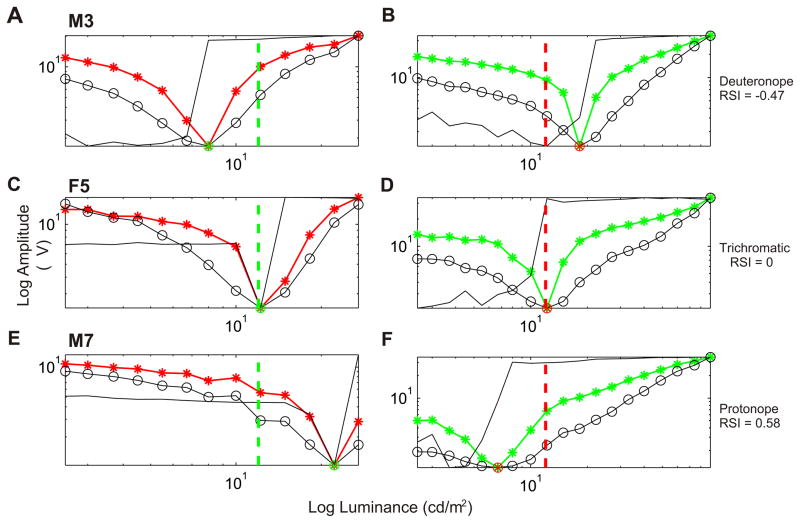
Fig. 4.
Response curves in two different conditions (right and left) for 3 animals. On the left, the luminance of the green square was fixed at 12 cd/m2, whereas the luminance of the red square was varied from 2.5 to 27 cd/m2 in 13 steps. On the right, the luminance of the red square was fixed at 12 cd/m2, whereas the luminance of the green square was varied from 2.5 to 90 cd/m2 in 19 steps. (A) Deuteranope, M3, (B) trichromat, F5, and (C) protanope, M7. For conventions see Fig. 3.

