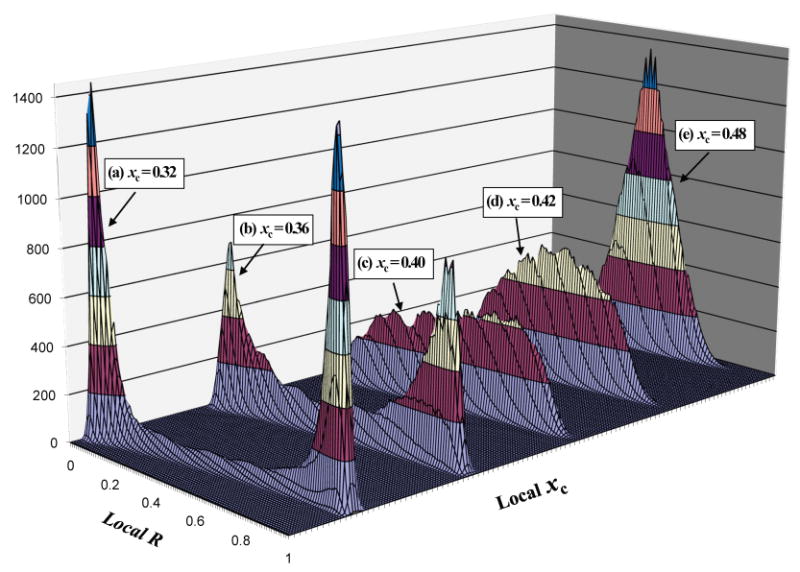
Figure 3.

Local composition histograms for the five mixtures in Fig. 2 reveals coexisting phases. A local lipid composition is specified by local R ratio and local χC. The vertical axis is the number of the lattice sites having a particular local lipid composition. Some histograms have been shifted in local χC axis to facilitate viewing. χC is the bulk (overall) cholesterol mole fraction of a simulated mixture.
