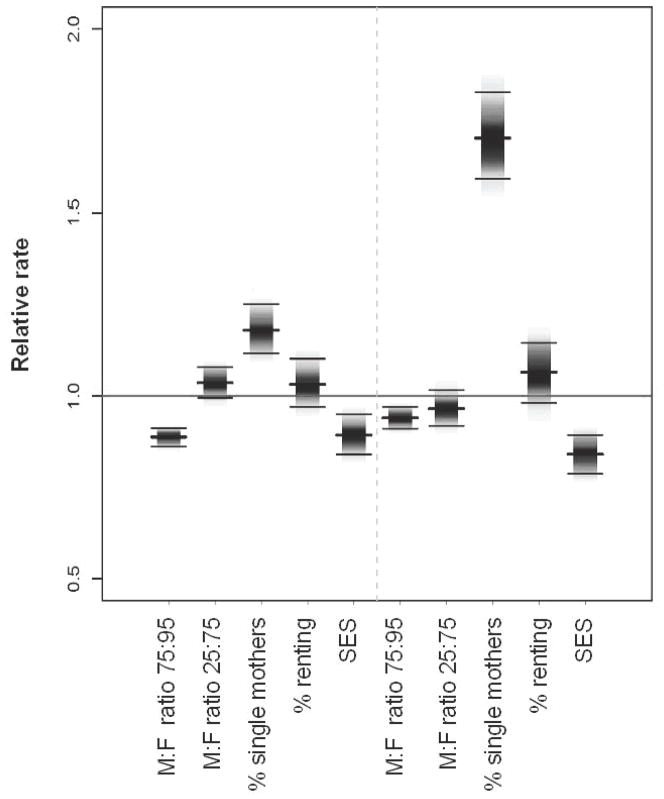
Figure 3.
Posterior means and interquartile range for the relative gonorrhea rate between two census tracts (neighborhoods) with the values of the social variables equal to the 1st quartile and 3rd quartile (see Table 1) with all other factors being equal; derived from the generalized linear mixed model with spatial random effects for the model with race/ethnicity (left) and without (right). The male-female ratio additionally shows the relative rate for census tracts in the 75th and 95th percentiles.

