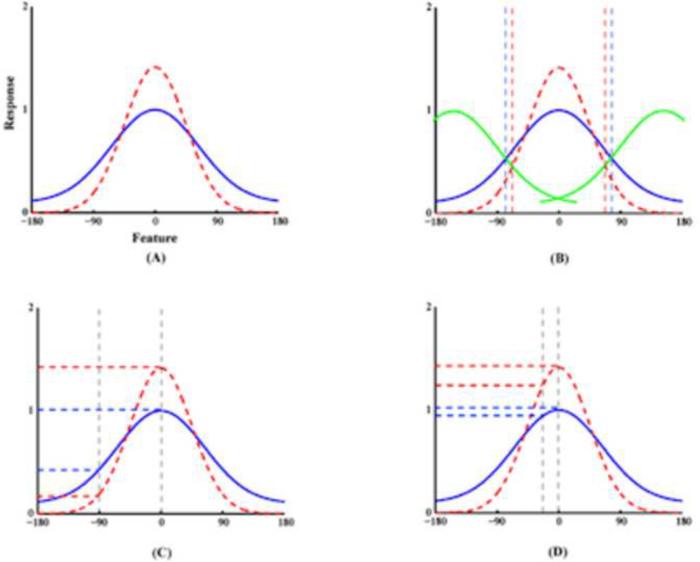
Figure 5.
Top-down modulation of perceptual response functions. (A) A graph replicated qualitatively from figure 2 of Boynton (Boynton, 2005) illustrating attentional effects on sensory response functions based on a `feature-similarity gain model' (Martinez-Trujillo and Treue, 2004). The effects include enhancement of the responses to the attended features and suppression of the responses to the unattended features (red dash line curve vs. blue solid line curve as modulated vs. baseline). (B) Increased discrimination capacity. Inward-shift of the boundaries (vertical dashed lines) makes it more likely for other perceptual `channels' (green solid curves) to respond to stimuli with features different from the attended due to the sharpened response profile in the `attended channel'. (C) Enhancement of the perceptual selectivity between different features achieved by increases of the response to the attended and decreases of the response to the unattended when the features are significantly different from each other, and (D) For features similar to the focus of attention, the contrast between responses to attended and unattended features is also increased though both responses to attended and unattended are increased.

