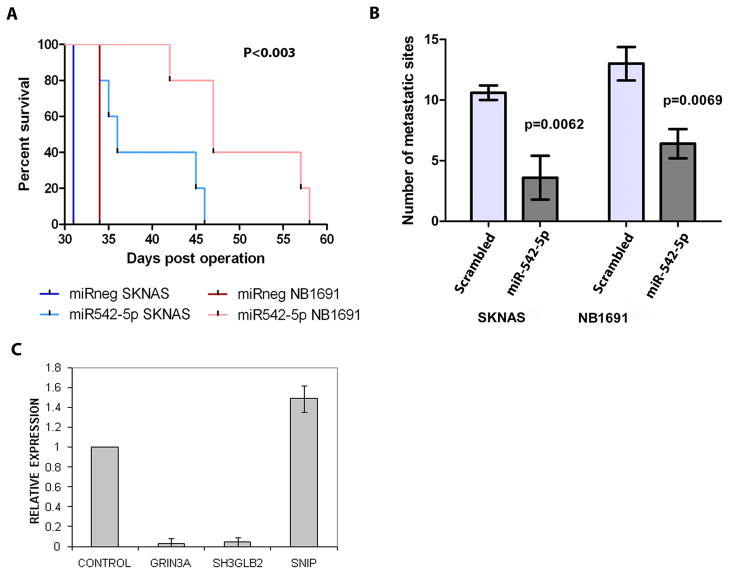
Figure 6.
(A) Animals were sacrificed at moribundity and Mantle-Cox statistical analysis was used to compare overall survival in xenograft cohorts. (n = 4–7 animals per group; p < 0.003 for both NB1691 and SKNAS models). (B) The number of metastases counted post-mortem in Pre-miR 542-5p-treated groups compared to negative control (scrambled) groups. (C) qPCR validation of genes identified as differentially expressed in response to miR-542-5p by microarray gene expression profiling of Kelly cells (see Supplementary Table 1). Average fold change of genes is represented.

