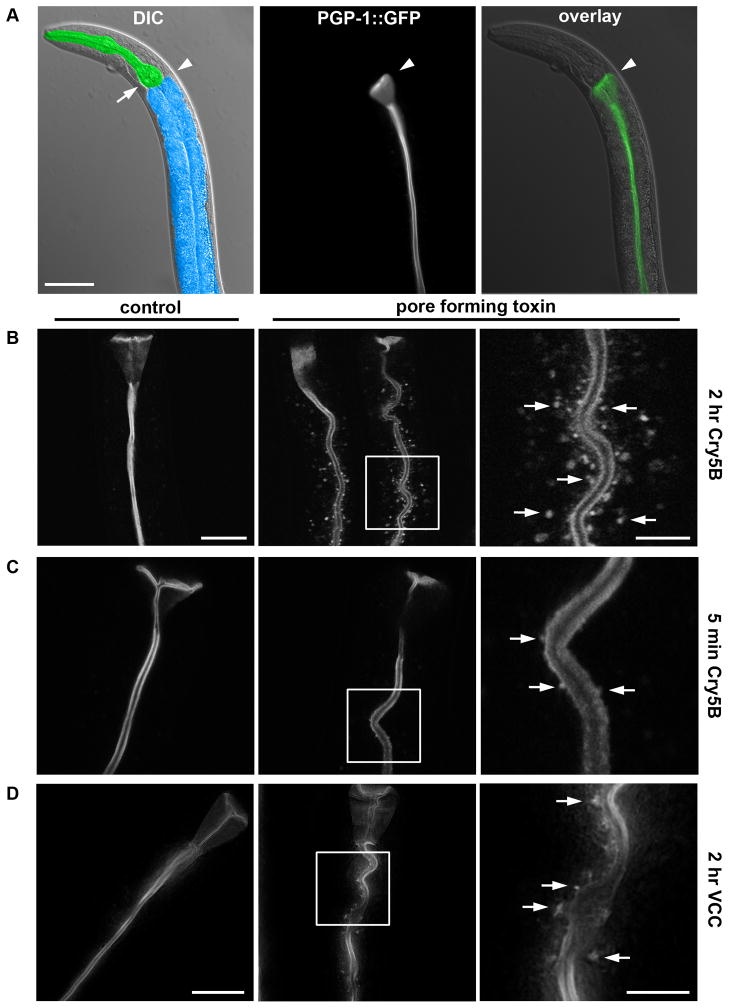
Figure 1. PFTs induce uptake of apical plasma membrane markers.
(A) Differential interference contrast (DIC) image of anterior half of C. elegans, with intestine false-colored in blue and pharynx in green; arrowhead indicates the transition from pharynx to intestine, and arrow indicates the posterior bulb of the pharynx (left). Fluorescence image (middle) and overlay over DIC image (right), showing PGP-1::GFP marks the apical plasma membrane of C. elegans intestinal cells. Scale bar: 50 μm. (B) Confocal images of PGP-1::GFP after 0 (left) or 2 hr (middle) exposure to E. coli-expressed Cry5B. Indicated area in the middle panel was magnified 3x (right), with arrows indicating intracellular PGP-1::GFP-positive vesicular structures. Scale bar: 25 μm left (same for middle); 10 μm right. (C) Confocal images showing intracellular PGP-1::GFP-positive vesicular structures after 5 minutes exposure to E. coli-expressed Cry5B, which are absent from untreated animals. Panels and scales as (B). (D) Deconvolved images showing V. cholerae expressing VCC induces PGP-1::GFP relocalization to intracellular vesicular structures after 2 hr exposure (middle and right), whereas V. cholera lacking VCC does not (left). Occasionally, vesicles are visible in control images; these were confirmed to be autofluorescent gut granules (see Experimental Procedures). Scale bar: 25 μm left (middle same scale); 10 μm right.

