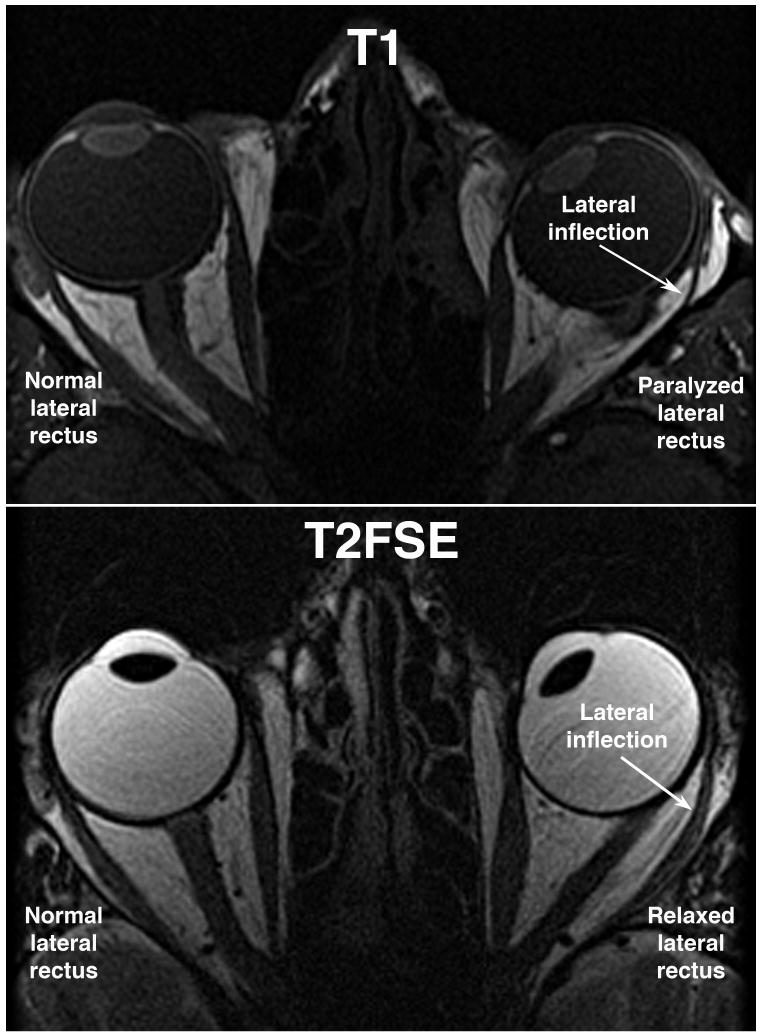
FIG 1.
Axial MRI in two comparable esotropic patients. T1 image above demonstrates dark signal from slower realignment of proton spin axes in the vitreous. T2FSE image below demonstrates bright signal from slower dephasing of proton spin axes in the vitreous. Horizontal rectus EOMs are well demonstrated with both methods. T1 demonstrates iris and ciliary body better than T2FSE.

