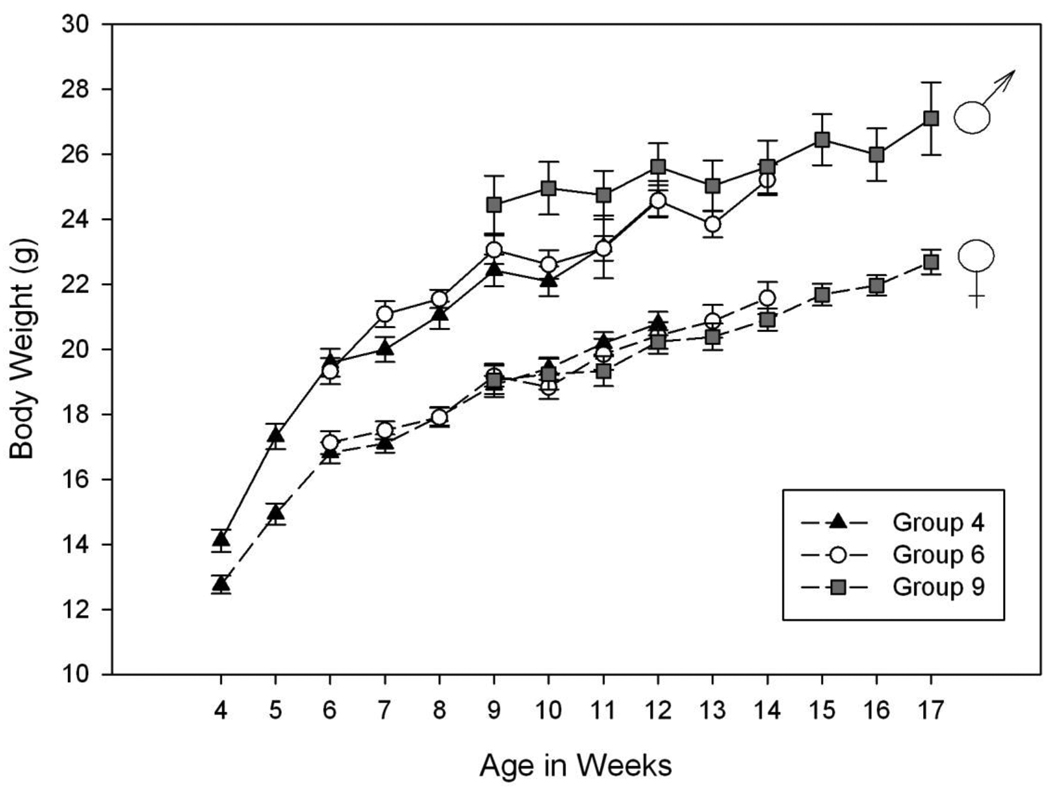
Figure 3.
Body weights by group and sex at different ages in HDID-1 mice in Experiment 2. Body weights were assessed on days 1 & 3 of each week of DID testing. The data shown represent the mean ± SEM age of the mice (in weeks) versus the body weights (g) on day 1 of each week. Groups of male mice are shown with solid lines; female mice are shown with dashed lines. Symbols represent group age at the start of testing. No significant differences among groups within sex were found. The male mice of the 4 and 6 week groups showed significantly lower body weight at 10 weeks of age, but not at other ages, than did the male mice of the 9 week group. There were no differences in body weight among groups in female mice of the same age.

