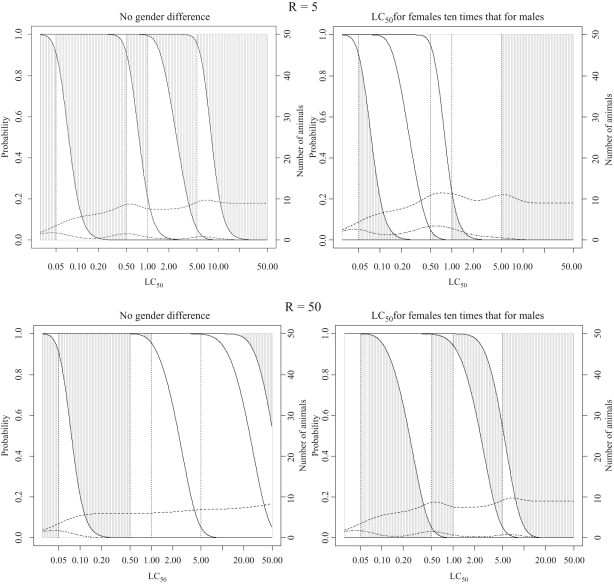
Figure 8.
Classification probabilities and expected numbers of animals for the fixed concentration procedure (FCP) starting at 0.05 mg/L for substances with concentration-response curve slope = 4 and different values of R = LC50/TC50 (see legend to Figure 5 and text of Results section for a detailed explanation of plotted lines and shaded regions).

