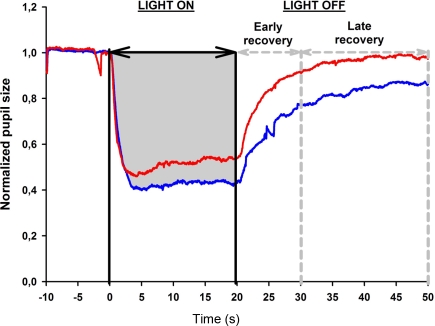
Figure 3.
Determination of the area under the curve (AUC) from the pupil response curve. The pupil size is plotted as a function of time under red and blue light stimulus conditions (red and blue lines, respectively, see also Figure 2). Pupil recording begins 10 s before light onset which is marked as time 0. The light stimulation is continuous for 20 s; after light offset, the pupil redilation is recorded for 30 s in darkness (time 20–50 s) and divided into two time windows: early and late pupil recovery. In this example, the AUC for the pupil response during 20 s of blue light stimulation is shown in gray.

