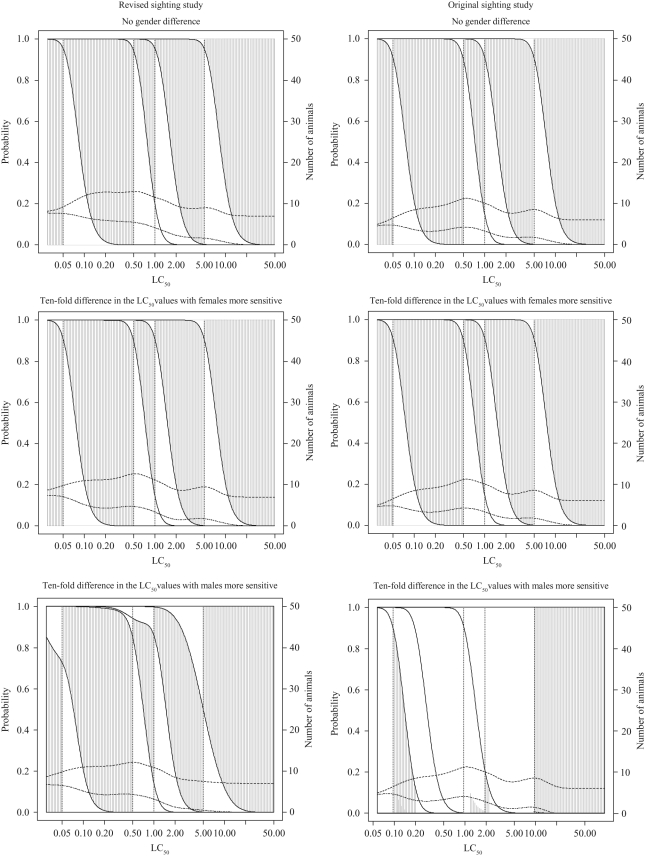
Figure 5.
Classification probabilities and expected numbers of animals and deaths for the fixed concentration procedure (FCP) with the new sighting study for dusts and mists with concentration-response curve slope of 4 and R (LC50/TC50) of 5 assuming sighting study starting at 5 mg/L (see legend to Figure 4 and Results section text for additional details).

