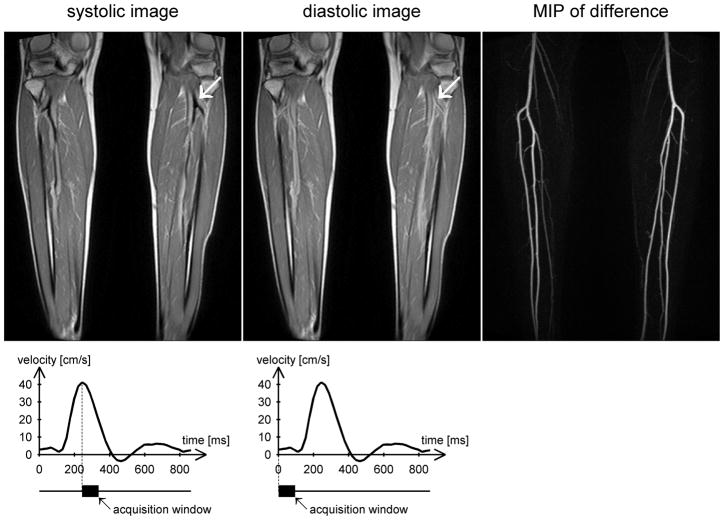
Figure 1.
Example images from a healthy volunteer acquired at 1.5T during peak systolic flow (left) and end-diastolic flow (center) using an ECG-gated 3D fast spin-echo sequence with a proton density weighted variable flip angle refocusing pulse train. The readout direction is head-foot (i.e. along the principal direction of flow). Note that the arteries appear dark during systole and bright during diastole (arrows). Subtracting the systolic images from the diastolic images produces a bright-blood angiogram, of which a maximum intensity projection (MIP) is shown on the right. The flow velocity time course obtained from phase contrast imaging through the popliteal arteries is plotted below, together with the acquisition windows for systolic and diastolic imaging.

