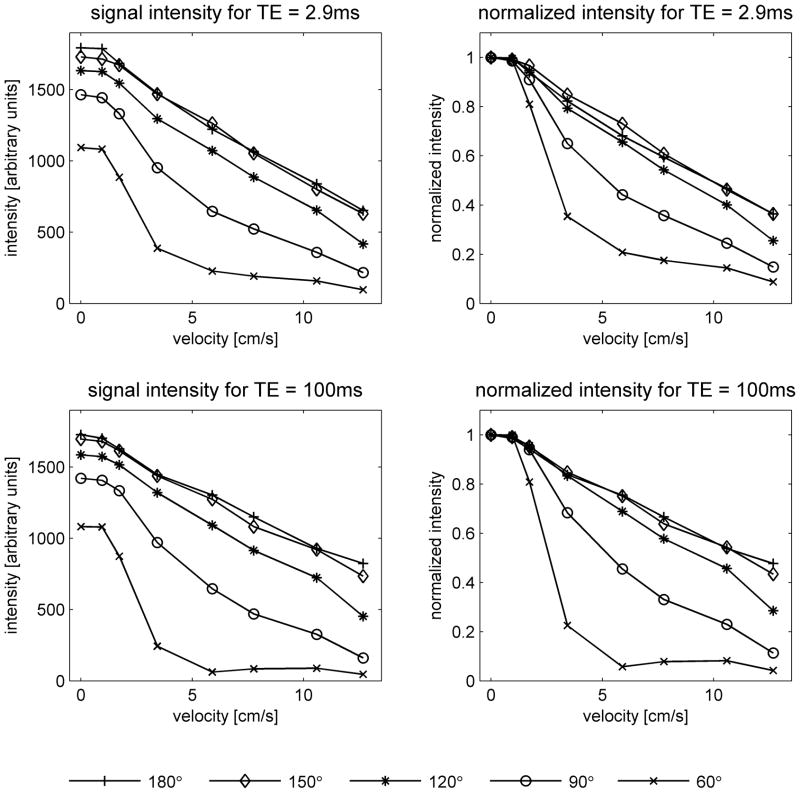
Figure 3.
Signal intensities in the phantom as a function of flow velocity. Values were measured at the center of the tubing on images acquired using the product fast spin-echo sequence with constant flip angle pulse trains. Data are shown for nominal flip angles of 60°, 90°, 120°, 150° and 180°, and echo times of TE = 2.9ms (top) and TE = 100ms (bottom). The graphs on the left show absolute signal intensity, while those on the right show the signal intensity normalized to its value at zero flow. Absolute intensity should not be directly compared between the two echo times, since the acquisitions had different TR. Note that the flow sensitivity increases as the flip angle is reduced.

