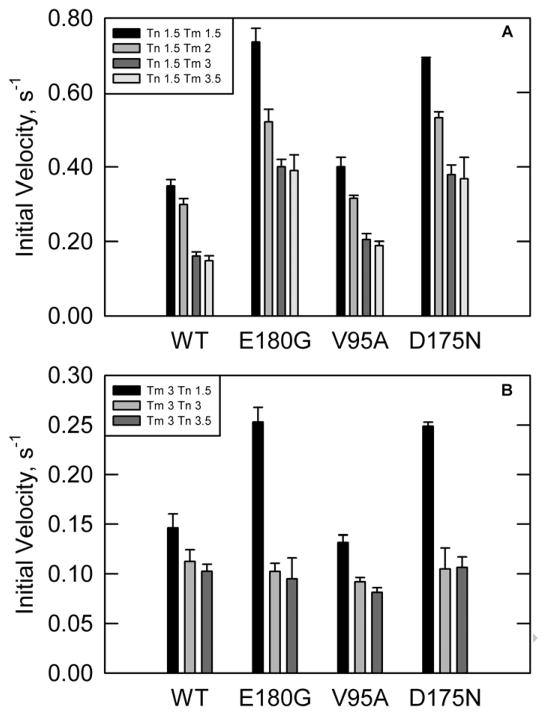
Figure 1.
ATPase rates in the absence of calcium. [S1] = 0.1 μM, [Actin] = 10 μM, temperature = 25°C, pH = 7.(A) Troponin concentration was fixed at 2.1μM. Legend shows stoichiometry of troponin and tropomyosins per 7 actin monomers. E180G and D175N show increased ATPase rates compared to wild type at all tropomyosin concentrations. V95A shows a slightly increased rate compared to WT at all concentrations of tropomyosin. (B)Tropomyosin concentration was fixed at 4.3 μM with varying troponin concentrations. Legend shows ratios of tropomyosin and troponin per 7 actin. E180G and D175N show a higher ATPase rate as compared to wild type at low troponin concentration. V95A has a lower ATPase rate than wild type at all troponin concentrations.

