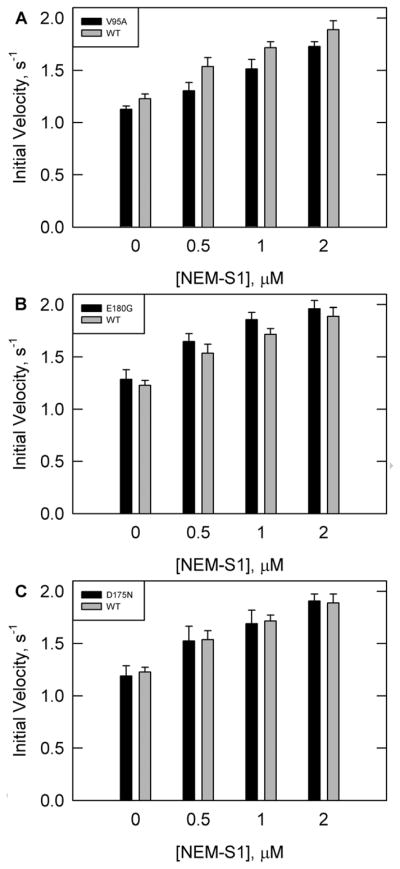
Figure 3.

ATPase rates in the presence of calcium with increasing concentrations of NEM-S1 and saturating concentrations of troponin and tropomyosin. Conditions are similar to Figure 2 except for varying NEM-S1 and a corresponding increase in actin as detailed in Materials and Methods. Tropomyosin was either WT (solid grey bars in all panels) or mutants(solid black bars) (A) V95A, (B) E180G, or (C) D175N.
