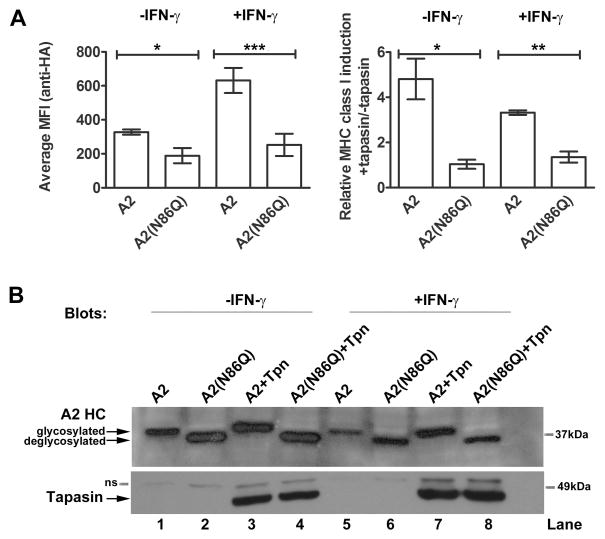
FIGURE 4. The conserved MHC class I glycan impacts tapasin-independent and tapasin-assisted MHC class I assembly.
A, Left panel: Bar graphs show mean fluorescence of M553 cells expressing HA-HLA-A2 or HA-HLA-A2(N86Q) as assessed by staining with the anti-HA antibody in untreated and 72 h IFN-γ treated cells (in the absence of tapasin expression). Cell surface expression of HA-HLA-A2(N86Q) was significantly impaired compared to that of HA-HLA-A2 both in IFN-γ treated cells (p = 0.0005; depicted as ***) and in untreated cells (p = 0.0404; depicted as *). Right panel: Tapasin-mediated induction of HA-HLA-A2 or HA-HLA-A2(N86Q) in untreated and 72 h IFN-γ treated M553 cells. Y axis shows ratio of MFI of MHC class I staining in M553 cells expressing tapasin and indicated class I relative to M553 cells expressing indicated class I alone (+tapasin/−tapasin MFI ratios). The differences in cell surface expression between HA-HLA-A2 and HA-HLA-A2(N86Q) were also significant in tapasin-expressing IFN-γ treated (p = 0.0018; depicted as **) or untreated cells (p = 0.0153, depicted as *). Paired t tests were used for the statistical analyses. B, Immunoblotting analyses of indicated cell lysates using antibodies specific for tapasin and HA-HLA-A2 (anti-HA). Data are averages of three (A) independent FACS analysis and the blots (B) are representative of two independent analyses. Non-specific bands are indicated as ns.

