
Figure 1.
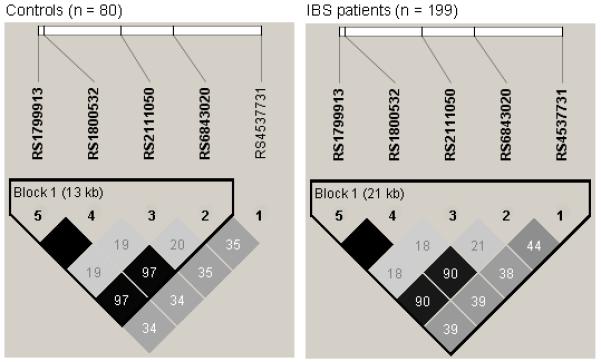
LD plot of the TPH1 SNPs genotyped in this study. Each diamond in the LD plot represents the strength of pairwise LD, with dark color indicating strong LD. The pairwise R2 values are written in the boxes. Haplotype blocks are indicated with a surrounding black line using the method of Gabriel et al (2002).(39)