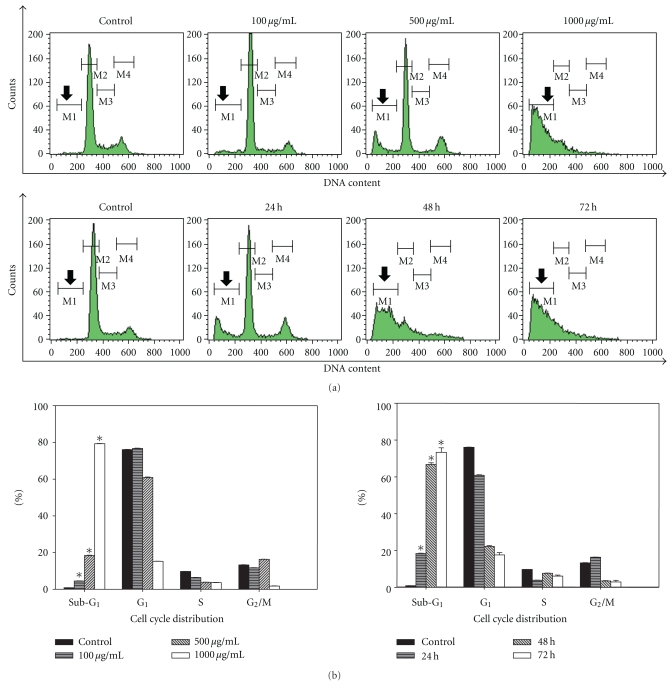
Figure 3.
Effect of LIEAF on the cell cycle distribution of Ca Ski cells. Ca Ski cells were incubated in the absence (control) or presence of 100, 500, and 1000 μg/mL of LIEAF for 24 hours. In another experiment, Ca Ski cells were incubated in the absence (control) or presence of 500 μg/mL of LIEAF for 24, 48, and 72 hours. The cells were then stained with PI solution and analyzed by flow cytometer. (a) Histograms obtained from PI staining. The region M1 shown by the arrows is corresponding to cells with sub-G1 DNA content. (b) Bar charts showed the cell cycle distribution upon LIEAF treatment. The asterisk represented significantly different value from control (*P < .05). The data represent mean ± S.E. of three different experiments.

