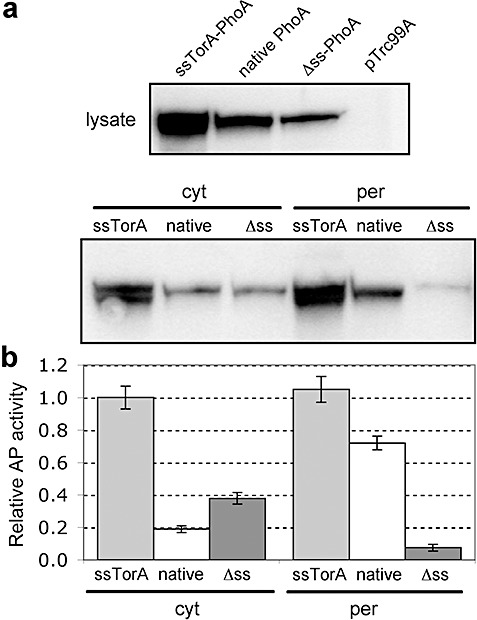
Figure 3.

Intracellular localization and activity of ssTorA–PhoA. A. Western blot analysis of total soluble lysate (top panel) and cytoplasmic (cyt) and periplasmic (per) fractions (bottom panel) from FÅ113 cells expressing Tat‐targeted (ssTorA), Sec‐targeted (native) and cytoplasmic (Δss) PhoA and empty vector pTrc99A control cells. Western blots were probed with anti‐PhoA primary antibody. B. PhoA activity in the above cells and constructs assayed in both the cytoplasmic and periplasmic fractions. All data normalized to the activity measured for ssTorA–PhoA in the periplasmic fraction. Data represent the average of three replicate experiments.
