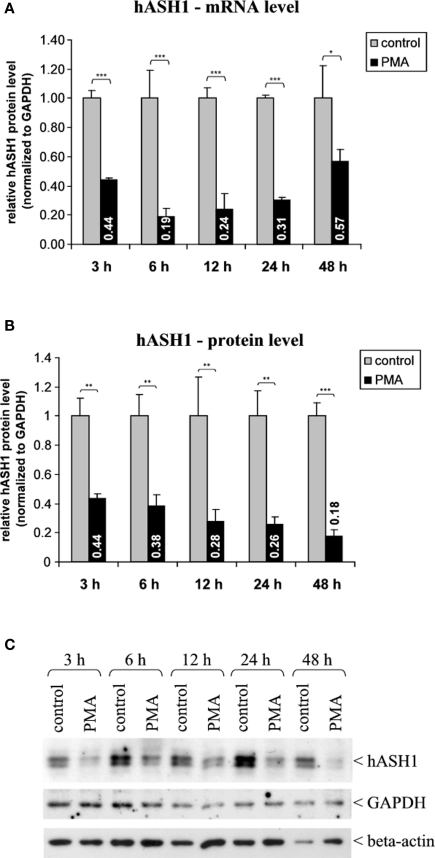
Figure 1.
Human achaete-scute homolog-1 mRNA and protein levels following PMA (40 nM) treatment. (A) Determination of hASH1 mRNA levels by qRT-PCR (n = 9). (B) Statistical analysis of hASH1 protein levels obtained by Western Blotting (n = 6). (C) Representative Western blot analysis. Pools of six independent samples per condition are shown. Control cells were treated with PMA solvent (ethanol). Detection of GAPDH and beta-actin served as loading controls. Shown are mean values, and error bars represent the standard deviation (SD). *p < 0.05, **p < 0.01, ***p < 0.001.

