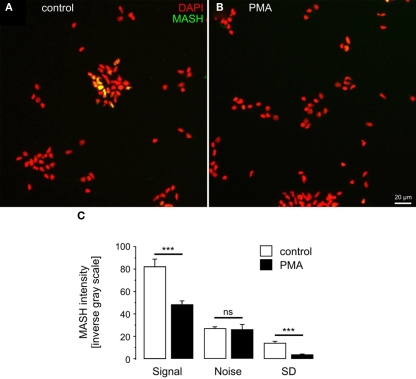
Figure 8.
Phorbol 12-myristate 13-acetate induces Mash1 suppression in primary cortical cells. MASH1 expression in d.i.v. 2 control (A) and PMA-treated (B) cortex cells is shown. (C) Quantitative analysis of Mash1 intensity. Note that increasing values represent increasing fluorescence intensities. The standard deviation (SD) was used as a measure of cellular heterogeneity of Mash1 expression. n = 6 cultures; ***p < 0.001; ns, not significant.

