
Fig. 1.
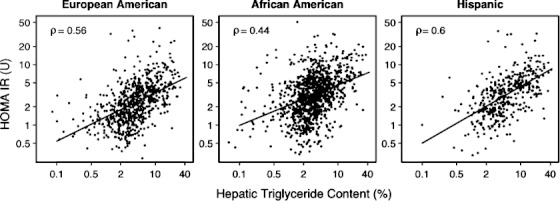
Relationship between HOMA-IR and HTGC with stratification by ethnicity in the Dallas Heart Study. The solid lines denote least squares regression lines.
Official websites use .gov
A
.gov website belongs to an official
government organization in the United States.
Secure .gov websites use HTTPS
A lock (
) or https:// means you've safely
connected to the .gov website. Share sensitive
information only on official, secure websites.
Relationship between HOMA-IR and HTGC with stratification by ethnicity in the Dallas Heart Study. The solid lines denote least squares regression lines.