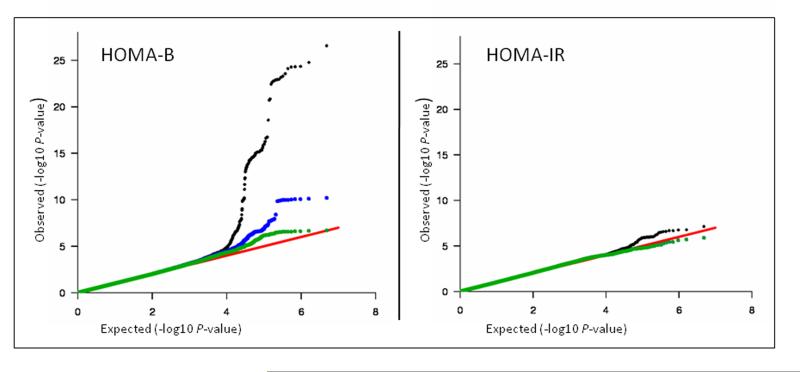
Figure 3. Quantile-Quantile Plots for HOMA-B and HOMA-IR in a large meta-analysis.
Figure adapted from reference35.
The quantile-quantile (QQ) plot illustrates the observed P values in the distribution versus those that were expected under the null hypothesis of no association. The null distribution is depicted by the red diagonal line. The entire distribution of P values is in black, the exclusion of the ten newly discovered loci (DGKB-TMEM195, ADCY5, MADD, ADRA2A, FADS1, CRY2, SLC2A2, GLIS3, PROX1, C2CD4B) in green, and the exclusion of the four genome-wide significant fasting glucose-associated loci reported previously (GCK, GCKR, G6PC2 and MTNR1B) in blue. The HOMA-B P values have a larger deviation from expected compared to HOMA-IR and therefore genetic associations with HOMA-B are more likely to be detected than with HOMA-IR.

