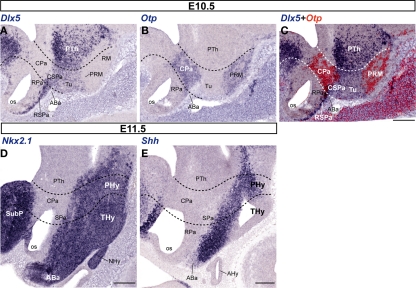
Figure 2.
Representative sagittal sections from E10. 5 (A–C) and E11.5 (D,E) embryos, showing the expression domains of Dlx5 (A), Otp (B), Dlx5 + Otp (C; digital overlap with pseudocolor of A,B), Nkx2.1 (D), and Shh (E). The transversal boundaries of the PHy and THy are indicated by dashed lines. Bars = 200 μm.

