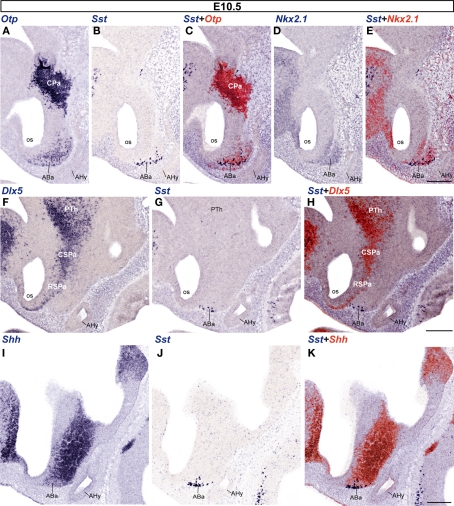
Figure 3.
Sagittal sections of E10. 5 embryos taken at lateral (A–E), intermediate (F–H), and medial (I–K) levels, correlating the indicated reference markers with the presence of Sst-positive cells. Note the topographic coincidence of Sst signal with a larger surrounding population of Otp-positive cells. Bars = 200 μm.

