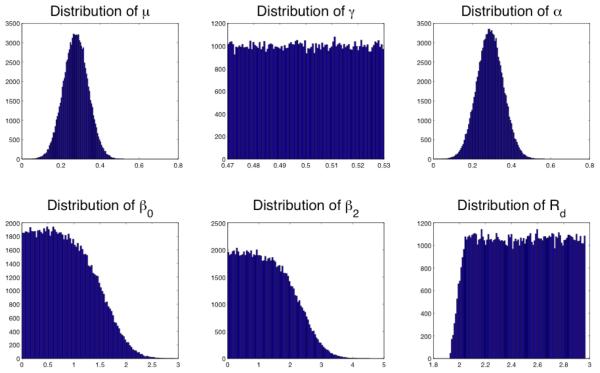
Figure 2.
Frequency distributions of the parameters including Rd when sampling γ from uniform distributions with mean 0.28. The overall shape of the distribution remains same for the cases when mean of γ-distribution was 0.50 and 0.83. Distributions were calculated from one of the 10 Monte-Carlo samples, each of size 105 sampled parameter values using approach described in the text. Horizontal axis has parameter values, and vertical axis represents frequencies in the graphs.

