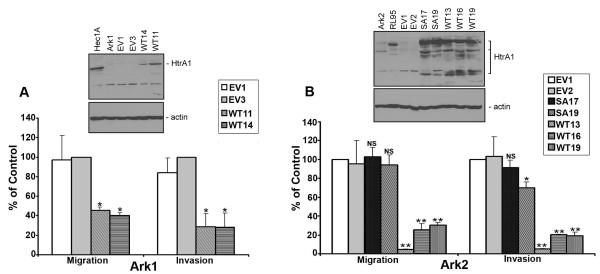
Figure 3.
Exogenous expression of HtrA1 inhibits migration and invasion of Ark 1 and Ark 2 cells in vitro. Results from matrigel invasion and migration assay show decreased number of Ark 1 and Ark 2 cells invading through the basement membrane (expressed as % of control cells) in with WT HtrA1 expressing cells compared to EV or SA mutant HtrA1 transfected controls respectively. Insets in (A and B) shows the expression of WT HtrA1 in Ark 1 clones 11 and 14 and Ark 2 clones 13, 16,and 19. Mutated HtrA1 in SA clones 17 and 19 in Ark 2 cells and absence of expression in Ark 1 and Ark 2 EV1 and EV3 cells by immunoblot analysis with β-actin loading control (lower panel) respectively. NS- Not significant, **P =<0.01 and *P=<0.05 between HtrA1 WT and Vector (V1) controls.

