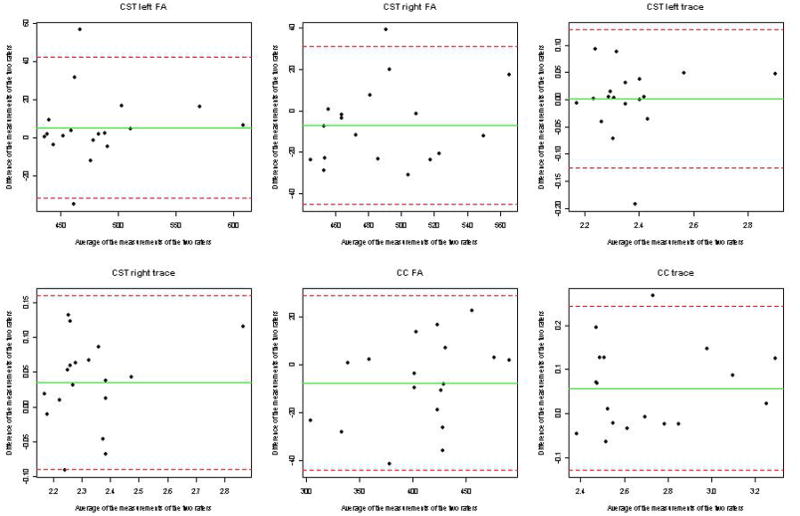
Figure 3.

Plot of difference versus mean (Bland-Altman plot) for data on agreement between the two raters for the diffusion tensor imaging variables fractional anisotropy, Trace for the corticospinal tracts (CST) of both sides and the corpus callosum. According to the Bland-Altman approach it is expected that one observation will fall outside the ‘limits of agreement’ in case of a sample size of n=18. Our study results reveal two observations outside the limits of agreement for the fractional anisotropy of the left CST. For the measures CST right fractional anisotropy, CST left trace, CST right trace, and corpus callosum trace, only one observation, and for corpus callosum fractional anisotropy no observation is outside these limits. In addition, the plots show that the within-repeatability is not associated with the size of the measurement.
