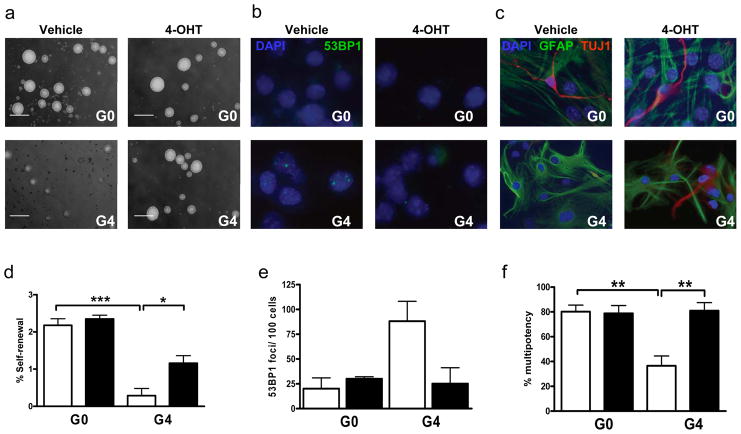
Figure 3. Neural stem cell function following telomerase reactivation in vitro.
Representative images of experimental and control mice-derived (a) neurospheres, (b) differentiated NSCs stained with 53BP1 or (c) GFAP and TUJ1 antibodies. (d) Self-renewal capacity of secondary neurospheres (n=4) ***p<0.0001, *p<0.001. (e) Percentage of cells displaying 53BP1 nuclear foci (>400 nuclei/culture, n=3). (f) Multipotency (GFAP+/TUJ1+) of NSCs (n=4, 308 wells/culture condition) **p=0.0066. Scale bar represents 100μm. Open bars correspond to vehicle-treated and filled bars to 4-OHT-treated groups, error bars represent s.d.

