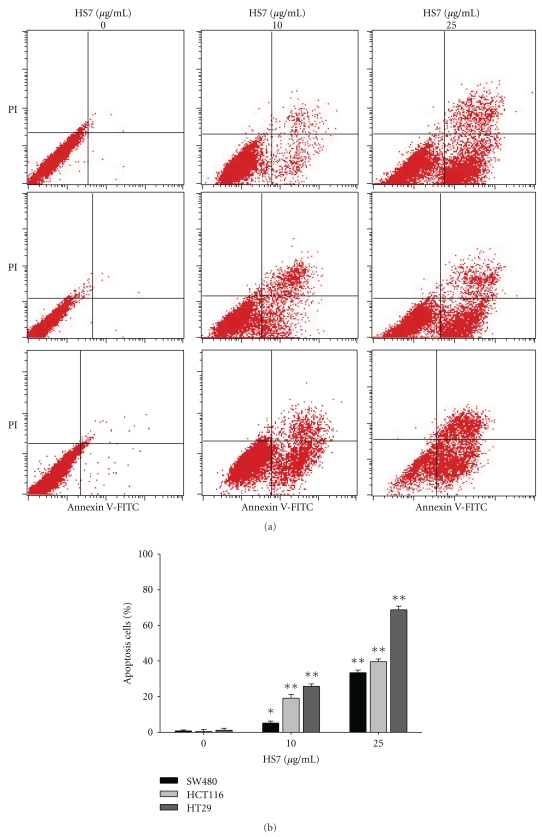
Figure 2.
HS7 induced apoptosis in human colon cancer cells. (a) SW480, HCT116, and HT29 cells were treated with a range of HS7 (0, 10, and 25 μg/mL) for 48 h. Cells then were stained with annexin V/propidium iodide (PI) and analyzed by flow cytometry. Apoptotic cells were localized in the lower right (early apoptosis) and upper right (late apoptosis) quadrants of the dot-plot graph using annexin V versus PI. (b) Bar graphs represent the mean values of triplicate measurements ± SD. *P < .05; **P < .01, compared with control.

