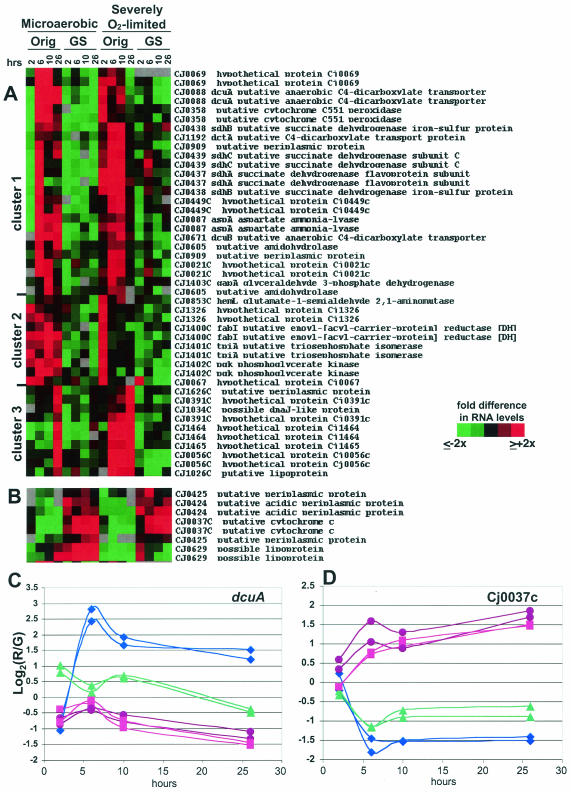
FIG. 5.
11168-O and 11168-GS cultured as described in the legend to Fig. 4 were harvested for RNA and gene expression analyses. SAM analysis was used to identify genes with statistically significant differences under both conditions. Panel A shows genes expressed more highly in 11168-O than in 11168-GS. Panel B shows genes expressed more highly in 11168-GS than in 11168-O. For both panels A and B, red indicates expression higher than the mean for each gene and green indicates lower expression than the mean (see key on figure). Panels C and D show numerical data, in log2 format, for both spots representing dcuA (C) and Cj0037c (D). For both panels C and D, the y axis is the log2 of the red/green (R/G) ratio relative to the mean for that gene; the actual difference (n-fold) from the mean for any particular data point is 2A, where A is the number on the y axis (i.e., if the y axis value is 1.5, the actual R/G level, or difference [n-fold] from the mean, is 21.5, or ∼3.7). Also for panels C and D, purple circles are microaerobic 11168-GS; blue diamonds are microaerobic 11168-O; pink squares are severely O2-limited 11168-GS; and green triangles are severely O2-limited 11168-O.

