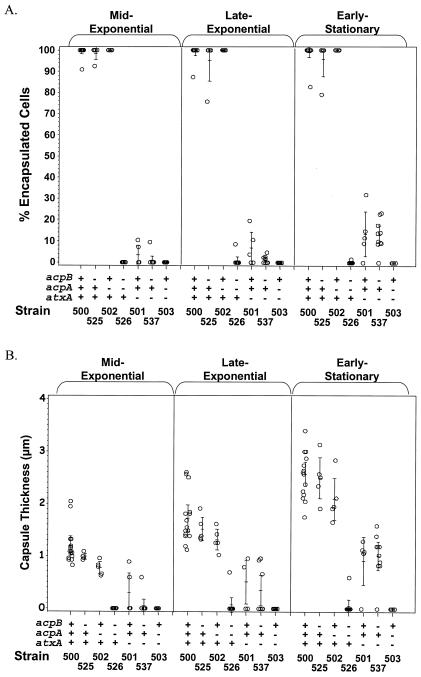
FIG. 3.
Comparison of capsule production by UT500 and mutant strains at mid-exponential, late exponential, and early stationary growth phases. (A) Percentages of capsulated cells. (B) Mean diameters of capsules. Each circle represents data obtained from a single culture. Vertical lines with horizontal hash marks show means and 95% confidence intervals. Strain names are listed at the bottom, and the corresponding genotypes are indicated above (+ or − for the acpB, acpA, and atxA genes).

