
Fig. 2.
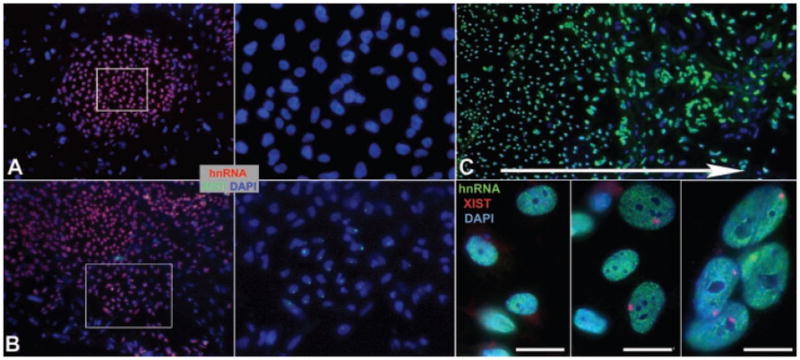
A: Undifferentiated H9 with no XIST territories. B: Undifferentiated H9 with a patch of XIST positive cells (cells in box enlarged at right for both). C: Differentiated H9 show increased XIST singals (red) with differentiation. Close-ups of cells from center (left), inner edge (middle) and outer edge (right) of differentiating colony in the large low-mag image. Arrow indicates the direction of increased differentiation, and increased number of XIST positive cells. Scale bars are 10 μM.