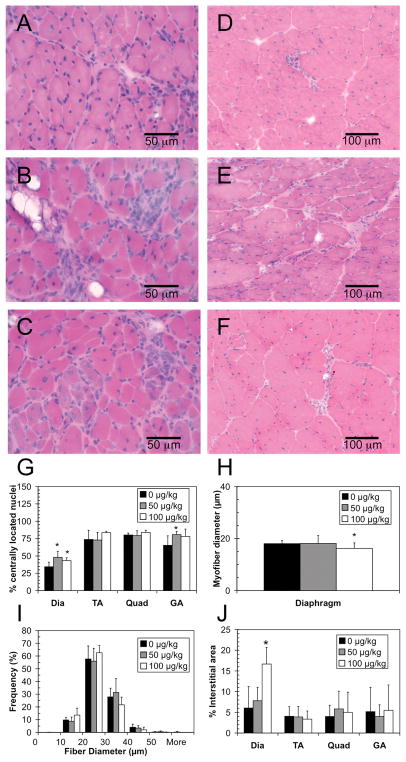
Figure 2.
Muscle histology of mdx mice treated with C-EPO for 4 weeks. A–C: H&E stained diaphragm, scale bar = 50 μm. D–F: H&E stained gastrocnemius, scale bar = 100 μm. A, D: 0 μg/kg treatment. B,E: 50 μg/kg treatment. C,F: 100 μg/kg treatment. G: Percentage of centrally located nuclei in the diaphragm (Dia), tibialis anterior (TA), quadriceps (Quad), and gastrocnemius (GA) muscles. H: Average myofiber diameter in the diaphragm. I: Distribution of fiber diameters in the diaphragm. J. Percentage of interstitial area in diaphragm, tibialis anterior, quadriceps, and gastrocnemius muscles. G–J: Black squares: 0 μg/kg. Gray squares: 50 μg/kg. White squares: 100 μg/kg C-EPO. ‘*’ denotes statistically significant difference versus control (p <0.05).

