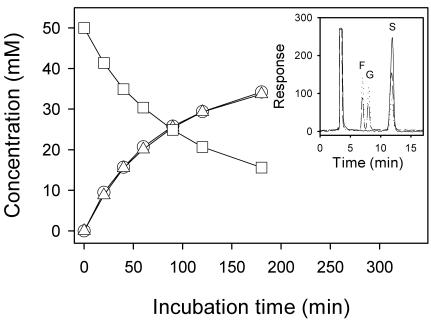
FIG. 2.
Time courses of sucrose consumption and glucose-fructose production by SUH. To 1.0 ml of 50 mM sucrose in 20 mM K-phosphate buffer (pH 7.5) kept at 30°C, 10 μl of the enzyme preparation (1.2 μg/μl) in the same buffer was added, and the reaction mixture was incubated at 30°C. Aliquots (0.1 ml each) were drawn at the time intervals shown, immediately boiled for 2 min, filtered through Millipore membranes (0.2-μm pore size), and then subjected to HPLC analysis. Squares, sucrose; triangles, glucose; circles, fructose. The inset shows the representative HPLC chromatograms of samples taken 0 (solid line), 60 (broken line), and 180 (dotted line) min after the start of the reaction, respectively. The peaks are fructose (F), glucose (G), and sucrose (S) following the solvent peak.

