FIGURE 6:
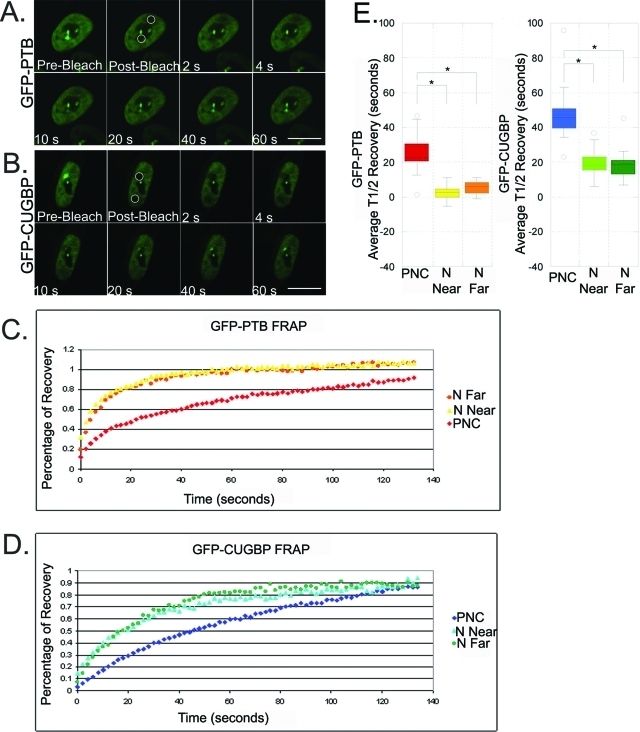
The dynamics of GPF-CUGBP and GFP-PTB differ between the PNC and nucleoplasm. (A) Select images are shown from a representative FRAP time series acquisition of transiently transfected GFP-PTB and (B) GFP-CUGBP in HeLa cells (n = 18). Circles in the prebleached image demarcate the two bleached regions subject to quantification in each cell. Scale bar = 10 μm. (C) FRAP studies on cells that were transfected with GFP-PTB or (D) GFP-CUGBP were averaged, and percentage recovery was plotted over time. (E) Box-and-whisker plots depict the distribution of the half-recovery times for GFP-PTB and GFP-CUGBP FRAP studies. At the PNC, GFP-PTB (t1/2 = 24.9) and GFP-CUGBP (t1/2 = 48.3) recovered more slowly than nucleoplasmic GFP-PTB (N Near t1/2 = 2.6, and N Far t1/2 = 5.3) and GFP-CUGBP (N Near t1/2 = 20.0, and N Far t1/2 = 19.0). Three ROI were quantified for each study: the PNC, nucleoplasm near the PNC (N Near), and nucleoplasm further from the PNC (N Far). Each study was corrected for photofading and normalized to the prebleached image before averaging. *p < 0.001; Student’s t test.

