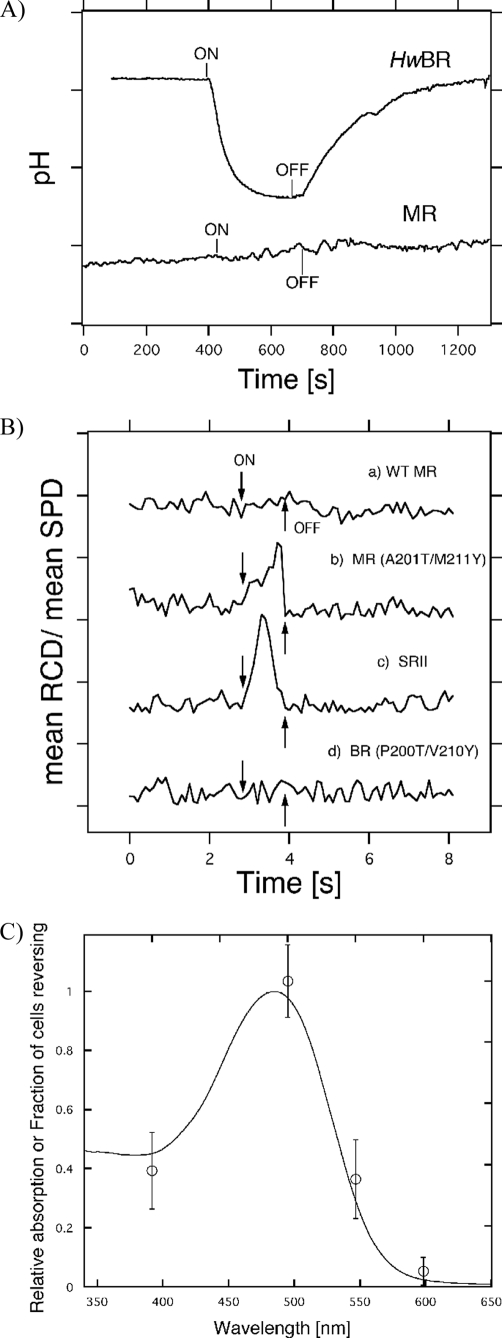
FIGURE 6.
A, light-driven pH changes in spheroplast vesicles containing HwBR or MR (50 mm MgSO4, 150 mm NaCl, initial pH ∼6.5). On and Off indicate the onset and offset of illumination (with yellow light, >500 nm for HwBR and >460 nm for MR), and the negative signal corresponds to a decrease in pH (outward proton transport). One division of the y axis corresponds to 0.1 pH unit. B, phototaxis responses of the MR-HtrII artificial complexes. On and Off indicate the onset and offset of illumination with >460 nm stimulus (1 s). Swimming reversal frequency responses of cell populations measured by stimulus effects on the ratio of rate of change of direction (RCD) to speed (SPD) by computer-assisted motion analysis. One division of the y axis corresponds to 50. C, action spectrum for the phototactic response in the transformant containing MR(P201T/M211Y)-HtrII. We measured phototaxis responses as swimming frequency changes to 1-s photo stimuli. Light intensities were normalized by using an actinometer, and we used four filters (400 ± 10, 500 ± 10, 550 ± 10, and 600 ± 10 nm).

