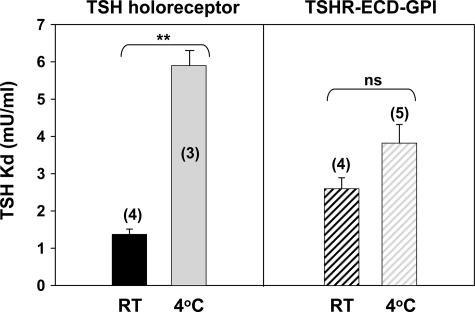
FIGURE 4.
Decreased TSH binding affinity at 4 °C for the TSH holoreceptor but not for the TSHR ECD-GPI. The bars represent the mean ± S.E. of Kd values (milliunits/ml) for the TSH holoreceptor and TSHR ECD-GPI at room temperature (RT) and 4 °C. The number of experiments is indicated in parentheses. ns, not significant. **, p = 0.00007 (Student's t test).

