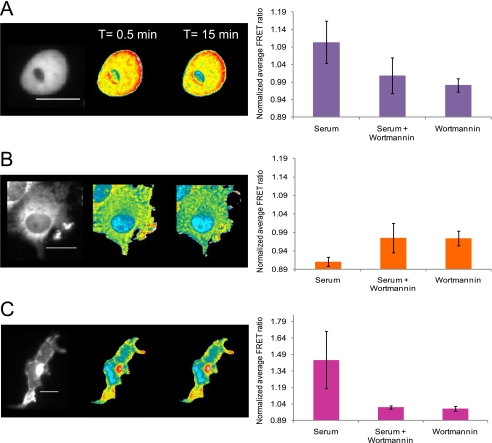
FIGURE 6.
Inhibition of the PI3K pathway by wortmannin abolishes O-GlcNAc dynamics in response to serum. Serum-starved Cos7 cells transfected with the either the nuclear, the cytoplasmic, or the plasma membrane targeted OS2 sensors were pretreated with wortmannin (100 nm) for 30 min followed by stimulation with serum as before (supplemental Movies 7, 8, and 9, respectively). The YFP channel image (far left) shows the distribution of the reporter in the cell. Changes in FRET response for serum-starved Cos7 cells treated with wortmannin and serum are illustrated by pseudocolor images. The color bar represents the FRET ratio values. The scale bar represents 20 μm for all sensors. The bar graphs at the right of the FRET images represent the average FRET response of the sensors for a select number of cells treated with either serum, serum and wortmannin, or wortmannin alone. A, Nuc-OS2 data. The bar graph at the right represents the average data of seven cells with the S.D. for each treatment condition. B, Cyto-OS2 data. The bar graph at the right represents the average data of three cells with the S.D. for each treatment condition. C, PM-OS2 data. The bar graph at the right represents the average data of three cells with the S.D. for each treatment condition.

