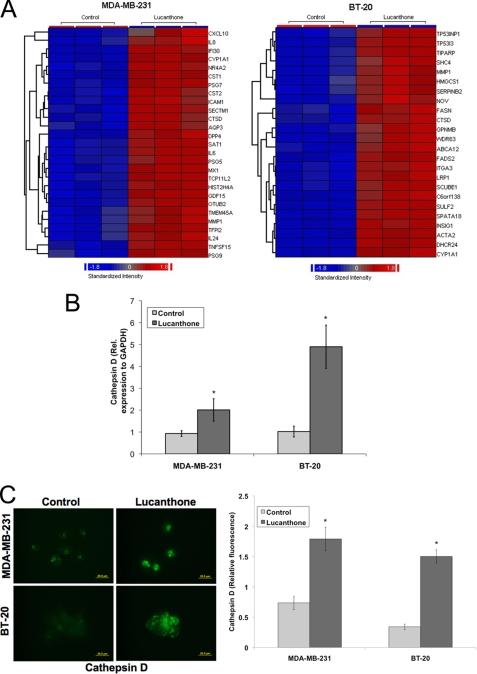
FIGURE 3.
Cathepsin D expression is highly elevated following lucanthone treatment. A, affymetrix expression arrays identify cathepsin D (CTSD) as a strongly up-regulated gene in both MDA-MB-231 and BT-20 cells. Cells were treated with 10 μm lucanthone for 48 h. RNA isolation and expression arrays were performed as described under “Experimental Procedures.” Data represent genes up-regulated by at least 4-fold following lucanthone treatment. B, quantitative real-time PCR analysis of cathepsin D expression in MDA-MB-231 and BT-20 breast cancer cells. Cells were treated with 10 μm lucanthone for 48 h and then harvested for analysis. Levels of mRNAs were standardized to the expression of GAPDH. Mean ± S.D., n = 4. *, indicates a significant difference from the controls. p < 0.05. C, lucanthone increases cathepsin D levels and promotes its aggregation. Breast cancer cells were treated for 48 h with 10 μm lucanthone. Cathepsin D was detected by immunofluorescence and quantified using ImageJ software. Mean ± S.D., n = 5. * indicates a significant difference from the controls. p < 0.05.

